
Introduction
Water treatment plants today face the dual pressures of reducing energy consumption and carbon emissions while simultaneously maintaining strict permit compliance. As energy prices fluctuate and environmental regulations tighten, traditional fixed operational schedules often lead to costly energy peaks and elevated greenhouse gas footprints. This article explores how reframing a water treatment plant as a grid-responsive production line can unlock significant environmental and economic benefits.
By leveraging operational flexibility, real-time data insights, and advanced scheduling, treatment plants can smooth energy use, cut carbon emissions, and maintain treatment quality without extensive capital investment. We will dive into proven strategies, share case studies, and outline practical operational tools designed to foster sustainable, measurable performance improvements.
1. Understanding the Challenges of Sustainable Water Treatment Operations
1.1 Energy and Carbon Spikes from Fixed Schedules
Most water treatment plants currently operate based on rigid setpoints and inflexible run times. These predetermined schedules cause energy consumption to spike during peak tariff periods, inflating operational costs and increasing carbon emissions. These peaks not only strain the facility’s budget but also amplify the plant’s carbon footprint, challenging sustainability goals.
For example, energy demand during fixed aeration cycles or sludge processing stages can sharply rise at peak hours. These surges worsen grid emissions since peak electricity often originates from carbon-intensive sources.
1.2 Risks from Influent Variability and Turbidity Swings
Water inflow patterns rarely remain stable. Storm events and scheduled maintenance commonly disrupt influent consistency, leading to highly variable turbidity and flow rates at the plant influent.
Such fluctuations complicate treatment process control and jeopardize adherence to regulatory permits. During flow surges, maintaining water treatment quality becomes especially challenging, requiring enhanced process flexibility and rapid responses to avoid compliance violations.
1.3 SOP Drift and Data-to-Action Gaps
Standard Operating Procedures (SOPs) tend to drift over time, especially during shift handovers where inconsistencies can arise. Such drift undermines the plant’s sustainability objectives and operational discipline.
Moreover, while modern Supervisory Control and Data Acquisition (SCADA) systems provide rich real-time data, the challenge lies in translating this information into actionable operator cues. This disconnect often causes missed opportunities for timely adjustments that could enhance energy efficiency and treatment quality.
2. Conceptualizing the Plant as a Grid-Responsive Production Line
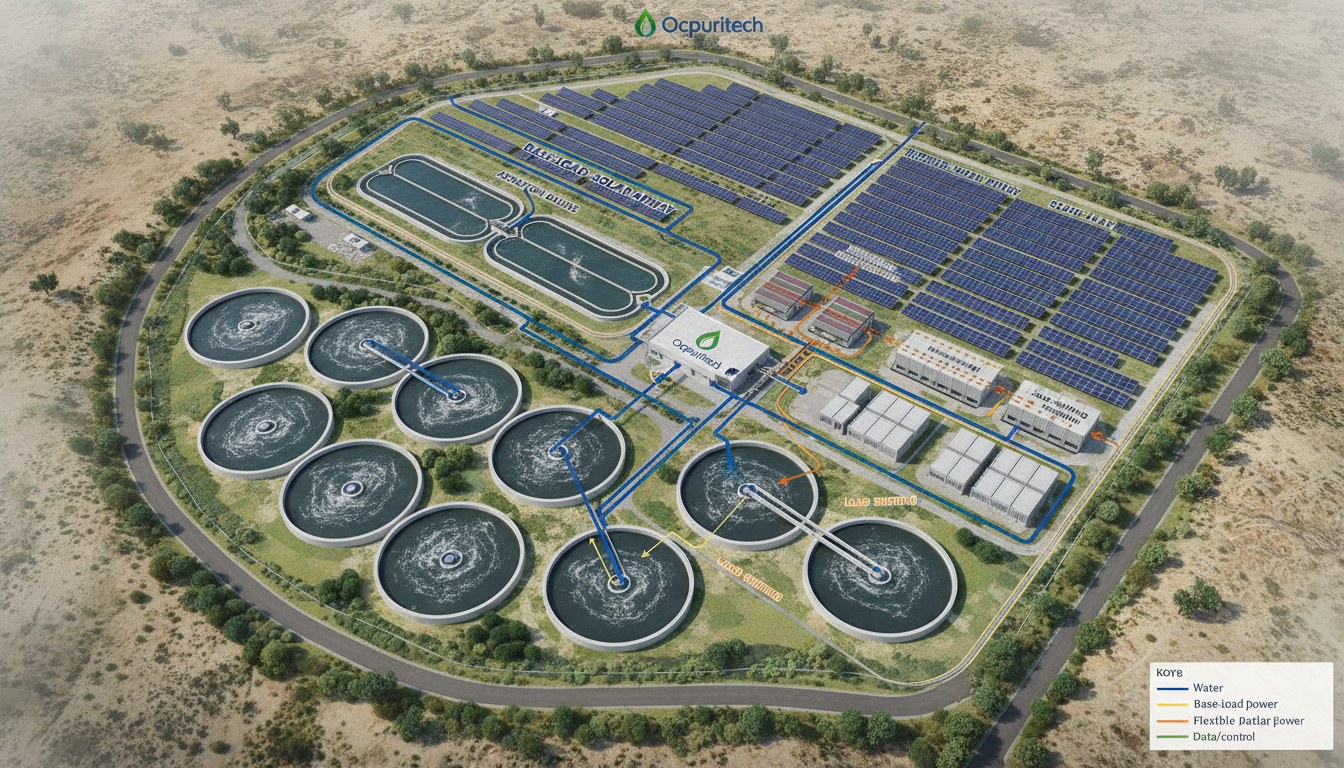
2.1 Mapping Flexibility Windows for Unit Processes
A key step to eco-friendly operation is identifying flexibility windows—timeframes when different unit processes can adjust operations without compromising treatment quality. For instance, some biochemical treatment units serve as a base load with continuous operation, while others, like pumps and aerators, have flexible load capacity that can be modulated.
By categorizing roles of plant components into base and flexible loads, operators can choreograph shifting activities away from peak grid carbon intensity and tariff periods. This targeted flexibility is essential for integrating renewable energy sources and reducing the plant’s carbon footprint.
2.2 Choreographing a 48-Hour Operational Shift Map
Developing a rolling 48-hour operational shift map enables smarter scheduling to balance inflows and manage energy use. By anticipating variable influent turbidity and flow, the plant can schedule energy-intensive tasks—such as aeration or sludge drying—in periods with lower grid carbon intensity or reduced tariffs.
This dynamic scheduling facilitates smoothing of energy peaks and turbidity loads, reducing costly spikes that typically increase emissions and regulatory risks.
2.3 Monetizing Sludge and By-products
Water treatment plants generate valuable by-products such as sludge and biogas. Integrating waste stream valorization enhances resource recovery and offsets energy use, leading to net carbon reductions.
Incorporating processes that monetize sludge through biogas production or high-quality compost can transform waste into income streams and reduce plant operating costs. These approaches support a circular economy model within the water treatment sector.
3. Proven Strategies to Optimize Water Treatment Energy Efficiency

3.1 Load Shifting and Demand Response Participation
An impactful strategy is load shifting, where high-energy processes are timed to off-peak hours or when grid carbon intensity is low. The Santa Rosa treatment plant achieved remarkable success by integrating into the off-peak energy market, reducing costs while contributing to grid stability.
This approach yielded up to 30% reductions in energy consumption during peak hours and lowered carbon emissions by shifting demand to cleaner energy periods.
3.2 Aeration Setpoint Optimization and Hysteresis Control
Aeration systems account for one of the largest energy draws in water treatment. By optimizing setpoints and employing hysteresis control via variable-frequency drives and AI algorithms, plants have realized up to 70% energy savings in aeration.
Advanced AI-driven control fine-tunes aeration precisely to biological oxygen demand fluctuations, reducing unnecessary energy use without compromising treatment efficacy.
3.3 Storm Surge Equalization and Turbidity Management
During heavy rainfalls, flow equalization tanks play a crucial role in stabilizing influent loads, protecting downstream processes from shock loads.
Real-time turbidity monitoring coupled with dynamic chemical dosing enhances precision in treatment responses to surge events, safeguarding permit compliance.
Our team implemented a storm-event response playbook at a Southeast Asian facility, resulting in a 25% improvement in compliance metrics during monsoon seasons.
| Strategy | Benefit | Implementation Complexity | Energy/Carbon Impact |
|---|---|---|---|
| Load Shifting | Peak cost savings and emissions reduction | Medium | Up to 30% kWh reduction |
| Aeration Optimization | Major energy draw reduction | High (needs controls/AI) | Up to 70% savings |
| Storm Surge Equalization | Quality and permit risk mitigation | Medium | Improves stability |
This table summarizes key strategies, their benefits, implementation complexity, and potential impact on energy and carbon footprints.
4. Tools and Operational Aids Enabling Streamlined Performance
4.1 Operator-Level Checklists and Event Playbooks
Providing operators with clear, actionable checklists and storm-event playbooks standardizes responses across shifts. These tools help harmonize SOPs and ensure sustainability goals remain a focus throughout operational handovers.
Incorporating scenario-based training prepares staff for rapid adjustment to influent variations or tariff changes.
4.2 Real-Time Carbon Intensity Overlays on SCADA
Integrating real-time grid carbon intensity data into SCADA interfaces empowers operators to align energy use with low-carbon periods automatically. Visual overlays showing carbon intensity trends guide decisions such as delaying non-critical loads or adjusting aeration setpoints.
4.3 Interactive Calculators and SOP Templates
Interactive calculators quantify potential energy and CO2 savings from operational changes, fostering data-driven decision-making. SOP templates institutionalize flexible, eco-conscious practices and ease training efforts.
5. Benchmarking and Measurable Outcomes for Continuous Improvement

5.1 Energy Intensity Benchmarks by Unit Process
Benchmarking energy intensity using public data from 2023 drinking and wastewater treatment plants allows facilities to compare their performance and identify opportunities for improvement. For example, aeration typically accounts for 50-60% of energy use in biological treatment units.
Tracking energy use by unit process highlights high-impact areas and focuses interventions effectively.
5.2 Class-Specific Efficiency Analysis
Latent class stochastic frontier analysis segments plants by operational characteristics to develop tailored efficiency improvement strategies. Research shows potential energy savings exceeding 40% are achievable without detriment to treatment quality when flexible operation is optimized.
5.3 Tracking and Reporting Carbon and Permit Compliance
Integrating sustainability claims with verifiable operational metrics enhances credibility with regulators and stakeholders. Transparent reporting on energy savings, carbon reductions, and permit adherence builds trust and supports long-term regulatory cooperation.
6. Integrating Industrial Demand Response into Water Treatment Operations
6.1 Demand Response Principles and Grid Benefits
Industrial demand response (DR) aligns plant energy demand with fluctuating utility grid carbon intensity. By reducing or shifting loads during peak periods, facilities avoid reliance on carbon-heavy peaker plants and help stabilize the grid.
6.2 Case Examples of Demand Response in Water/Wastewater Utilities
Several treatment plants have realized cost savings and enhanced grid stability through demand response participation. For instance, a plant in California integrated biogas generation with load shifting, lowering electric demand during critical hours while utilizing onsite renewables.
6.3 Future Trends: ICT and AI Enabling Smarter Flexibility
Information and Communication Technologies (ICT) and Artificial Intelligence (AI) are enabling deeper integration and optimization of energy management. These tools anticipate grid signals and adapt plant loads intelligently, maximizing benefits while complying with evolving regulations and market designs.
7. Implementing an Eco-Runbook for Sustainable Plant Operation
7.1 Conducting an Operational Choreography Audit
A prerequisite for sustainable operation is performing an Operational Choreography Audit. This involves overlaying local tariff and grid carbon data on SCADA outputs to identify plant-specific flexibility windows and constraints.
7.2 Developing 48-Hour Shift Maps and Playbooks
Based on audit insights, plants design customized 48-hour shift maps and event playbooks. These documents enhance operational resilience by providing scenario-based guidance and flexible scheduling protocols.
7.3 Pilot Program Invitation and Anonymized Case Metrics
We invite water treatment facilities to pilot this approach during typical stress periods, such as high turbidity or equipment maintenance cycles. Transparent sharing of anonymized outcomes helps build knowledge, demonstrating that eco-friendly operation can be practical and cost-effective.
Conclusion: Driving Eco-Friendly Water Treatment Through Pragmatic Process Optimization
Reducing the environmental footprint of a water treatment plant relies not only on adopting new technologies but also on optimizing operational timing and flexibility. By embracing grid-responsive choreography, leveraging real-time data overlays, and implementing operator-centered protocols, plants can achieve significant reductions in energy use and carbon emissions while securing permit compliance.
Stakeholders are encouraged to apply these pragmatic strategies and tools to initiate a new era of sustainable and cost-effective water management, balancing ecological responsibility with operational efficiency.
Call to Action:
Explore how an Operational Choreography Audit tailored to your facility can uncover hidden energy savings and carbon reduction opportunities. Download our Eco-Runbook template and interactive calculator to transform your plant’s performance today.
FAQ on Streamlined Water Treatment Plant Processes for Eco-friendly Operations
Q1: What is a grid-responsive water treatment plant?
A grid-responsive water treatment plant is designed to adjust its operations dynamically based on electricity grid conditions, such as carbon intensity and energy tariffs, to optimize energy use and reduce environmental impact.
Q2: How to implement load shifting in water treatment plant operations?
Load shifting in water treatment plants involves scheduling high-energy processes during off-peak periods or when grid carbon intensity is low. This requires identifying flexible process windows, monitoring real-time grid data, and coordinating operational activities accordingly.
Q3: How to conduct an Operational Choreography Audit for sustainable water treatment?
An Operational Choreography Audit overlays local grid carbon intensity and tariff data onto plant SCADA outputs to identify operational flexibility and constraints. This audit uncovers opportunities for scheduling adjustments that reduce energy use and emissions.
Q4: How to optimize aeration system energy efficiency in water treatment plants?
Aeration optimization uses variable-frequency drives and AI-driven hysteresis control to adjust oxygen delivery precisely to biological demand. This process reduces energy consumption up to 70% without compromising treatment quality.
Q5: Why do Standard Operating Procedures drift affect sustainable water treatment plant operations?
Standard Operating Procedure (SOP) drift happens due to inconsistent shift handovers and varying operator actions. It undermines sustainability goals by causing operational inefficiencies and missed opportunities for energy savings.
Q6: What is the difference between load shifting and aeration optimization in water treatment energy management?
Load shifting targets reducing energy use by rescheduling processes, while aeration optimization focuses on improving the efficiency of aeration equipment. Both reduce energy consumption but address different operational aspects; combining them yields higher overall savings.
Q7: How does storm surge equalization help manage influent variability in water treatment plants?
Storm surge equalization uses flow equalization tanks to buffer variable influent loads during heavy rainfall, stabilizing turbidity and protecting treatment processes to maintain permit compliance and operational stability.
Q8: How do real-time carbon intensity overlays improve energy management in water treatment plants?
Real-time carbon intensity overlays on SCADA enable operators to align energy-intensive tasks with periods of low grid emissions, promoting smarter energy use and supporting participation in demand response programs like those at Santa Rosa treatment plant.
Q9: What is latent class stochastic frontier analysis in benchmarking water treatment plant efficiency?
Latent class stochastic frontier analysis segments plants by operational characteristics to benchmark energy efficiency and tailor improvement strategies. It helps target process optimizations without compromising water quality standards.
Q10: How does combining biogas generation and demand response benefit water treatment operations?
Integrating biogas generation from sludge with demand response participation allows facilities, such as the California plant example, to reduce electric demand during peak grid periods and utilize onsite renewable energy, enhancing sustainability and cost savings.


